
Question:
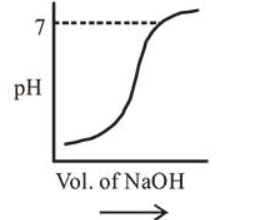
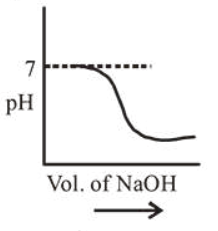
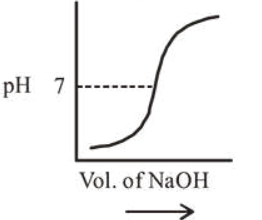
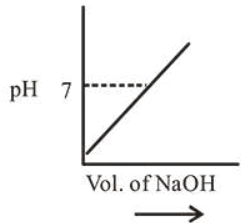
$100 \mathrm{~mL}$ of $0.1 \mathrm{MHCl}$ is taken in a beaker and to it $100 \mathrm{~mL}$ of $0.1 \mathrm{M} \mathrm{NaOH}$ is added in steps of $2 \mathrm{~mL}$ and the $\mathrm{pH}$ is continuously measured. Which of the following graphs correctly depicts the change in $\mathrm{pH}$ ?
Correct Option: , 3
Solution:
At equivalence point $\mathrm{pH}$ is 7 and $\mathrm{pH}$ increases with addition of $\mathrm{NaOH}$ so correct graph is (c).
Click here to get exam-ready with eSaral
For making your preparation journey smoother of JEE, NEET and Class 8 to 10, grab our app now.