A random survey of the number of children of various age groups playing in park was found as follows:

Question.
A random survey of the number of children of various age groups playing in park was found as follows:
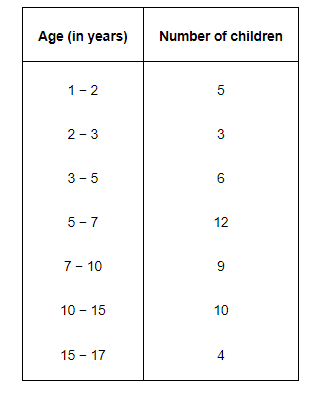
Draw a histogram to represent the data above.
A random survey of the number of children of various age groups playing in park was found as follows:
Draw a histogram to represent the data above.
Solution:
Here, it can be observed that the data has class intervals of varying width. The proportion of children per 1 year interval can be calculated as follows.
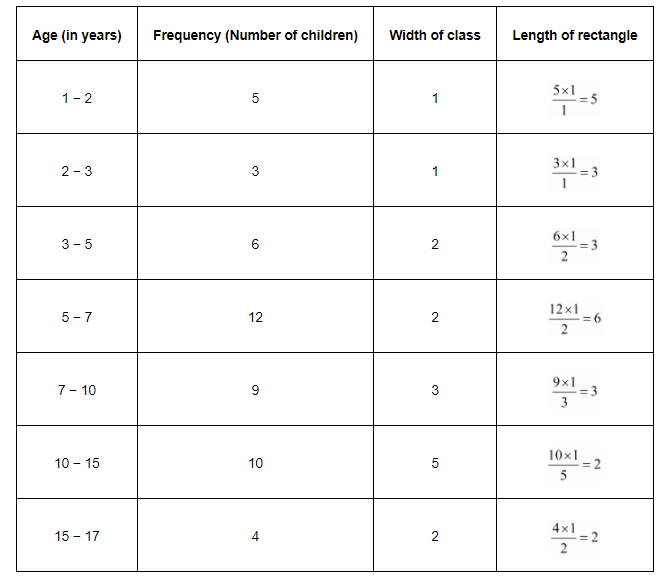
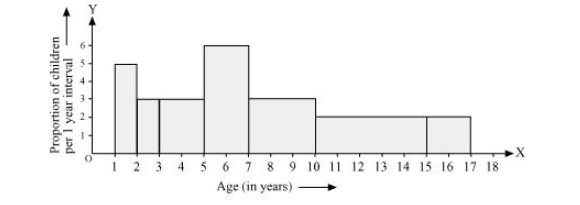
Taking the age of children on x-axis and proportion of children per 1 year interval on y-axis, the histogram can be drawn as follows.
Here, it can be observed that the data has class intervals of varying width. The proportion of children per 1 year interval can be calculated as follows.
Taking the age of children on x-axis and proportion of children per 1 year interval on y-axis, the histogram can be drawn as follows.
Click here to get exam-ready with eSaral
For making your preparation journey smoother of JEE, NEET and Class 8 to 10, grab our app now.