
Question:
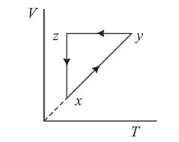
A thermodynamic cycle $x y z x$ is shown on a $V-T$ diagram.
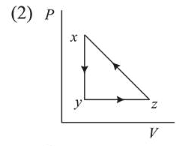
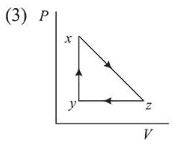
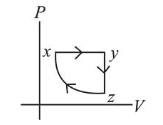
The $P-V$ diagram that best describes this cycle is: (Diagrams are schematic and not to scale)
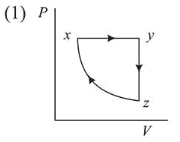
Correct Option: 1
Solution:
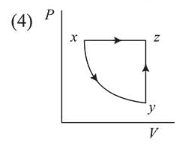
(1) From the corresponding V-T graph given in question,
Process $x y \rightarrow$ Isobaric expansion,
Process $y z \rightarrow$ Isochoric (Pressure decreases)
Process $z x \rightarrow$ Isothermal compression
Therefore, corresponding $P V$ graph is as shown in
figure
Click here to get exam-ready with eSaral
For making your preparation journey smoother of JEE, NEET and Class 8 to 10, grab our app now.