
Question.
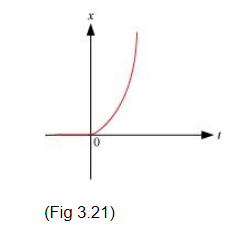
Figure $3.21$ shows the $x-t$ plot of one-dimensional motion of a particle. Is it correct to say from the graph that the particle moves in a straight line for $t<0$ and on a parabolic path for $t>0$ ? If not, suggest a suitable physical context for this graph.
Figure $3.21$ shows the $x-t$ plot of one-dimensional motion of a particle. Is it correct to say from the graph that the particle moves in a straight line for $t<0$ and on a parabolic path for $t>0$ ? If not, suggest a suitable physical context for this graph.
solution:
The $x-t$ graph of a particle moving in a straight line for $t<0$ and on a parabolic path for $t>0$ cannot be shown as the given graph. This is because, the given particle does not follow the trajectory of path followed by the particle as $t=0, x=0$. A physical situation that resembles the above graph is of a freely falling body held for sometime at a height
The $x-t$ graph of a particle moving in a straight line for $t<0$ and on a parabolic path for $t>0$ cannot be shown as the given graph. This is because, the given particle does not follow the trajectory of path followed by the particle as $t=0, x=0$. A physical situation that resembles the above graph is of a freely falling body held for sometime at a height
Click here to get exam-ready with eSaral
For making your preparation journey smoother of JEE, NEET and Class 8 to 10, grab our app now.