
Question:
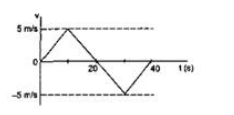
From the velocity-time plot shown in the given figure, find the distance travelled by the particle during the first 40seconds. Also find the average velocity during the period.
Solution:
Distance $=$ Area of $v$-t graph
$=\left(\frac{1}{2} \times 20 \times 5\right)+\left(\frac{1}{2} \times 20 \times 5\right)$
$=100 \mathrm{~m}$
Displacement $=\left(\frac{1}{2} \times 20 \times 5\right)+\left(-\frac{1}{2} \times 20 \times 5\right)$
Displacement $=0$
$\overrightarrow{V_{\text {ang }}}=\frac{\text { displacement }}{\text { time }}$
$\vec{V}_{\text {avg }}=0$
Click here to get exam-ready with eSaral
For making your preparation journey smoother of JEE, NEET and Class 8 to 10, grab our app now.