
Question:
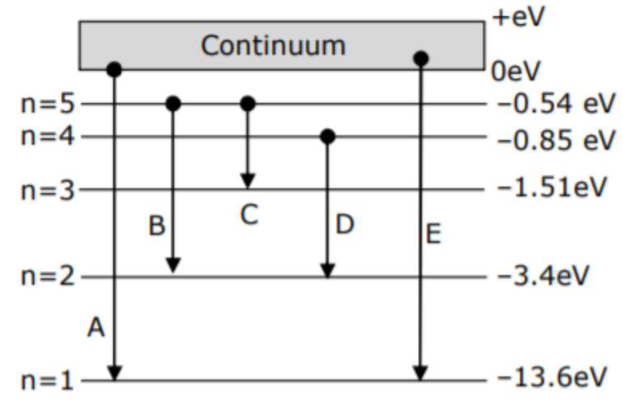
In the given figure, the energy levels of hydrogen atom have been shown along
with some transitions marked $\mathrm{A}, \mathrm{B}, \mathrm{C}, \mathrm{D}$ and $\mathrm{E}$. The transitions $\mathrm{A}, \mathrm{B}$ and $\mathrm{C}$
respectively represents -
Correct Option: 1
Solution:
(1)
$\mathrm{A} \rightarrow$ series limit of lyman.
$\mathrm{B} \rightarrow 3^{\text {rd }}$ member of Balmer series.
$C \rightarrow 2^{\text {nd }}$ member of Paschen series.
Click here to get exam-ready with eSaral
For making your preparation journey smoother of JEE, NEET and Class 8 to 10, grab our app now.