
Question:
Look at the bar graph given below.
Read it carefully and answer the following questions.
(i) What information does the bar graph give?
(ii) In which subject is the student very good?
(iii) In which subject is he poor?
(iv) What is the average of his marks?
Solution:
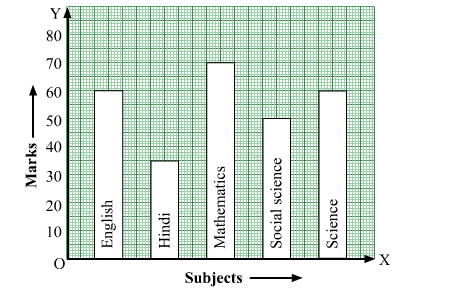
(i) The bar graph shows the marks obtained by a student in various subjects in an examination.
(ii) The student scores very good in mathematics, as the height of the corresponding bar is the highest.
(iii) The student scores bad in Hindi, as the height of the corresponding bar is the lowest.
(iv) Average marks $=\frac{60+35+75+50+60}{5}=\frac{280}{5}=56$
Click here to get exam-ready with eSaral
For making your preparation journey smoother of JEE, NEET and Class 8 to 10, grab our app now.