
Taking 0.5 cm as 1 unit, plot the following points on the graph paper A( 1, 3), 6(-3, -1,), C( 1, -4), D(-2, 3), E(0, -8) and F(1, 0).
Here, in point 4(1, 3) both x and y-coordinates are positive, so it lies in I quadrant. In point 8(-3, -1),both x and y-coordinates are negative, so it lies in
III quadrant. In point C(1, -4), x-coordinate is positive and y-coordinate is negative, so it lies in IV quadrant.
In point D(-2, 3), x-coordinate is negative and y-coordinate is positive, so it lies in II quadrant.
In point E(0,-8) x-coordinate is zero, so it lies on Y-axis and in point F(1,0) y-coordinate is zero, so it lies on X-axis.
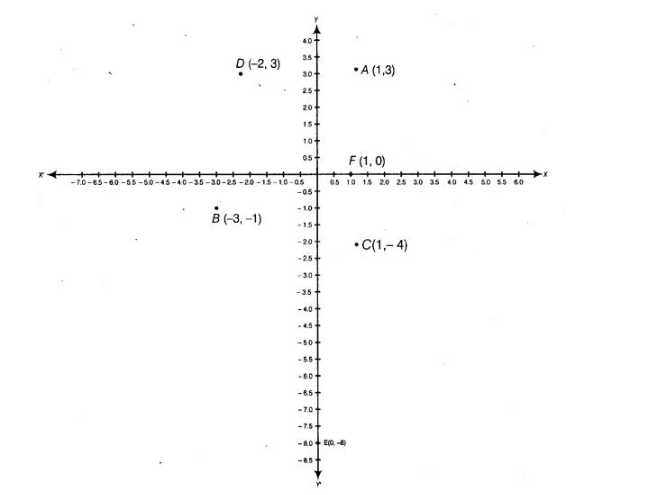
On plotting the given points, we get the following graph.
Click here to get exam-ready with eSaral
For making your preparation journey smoother of JEE, NEET and Class 8 to 10, grab our app now.