The following data gives the amount of loans (in crores of rupees) disbursed by a bank during some years:

The following data gives the amount of loans (in crores of rupees) disbursed by a bank during some years:
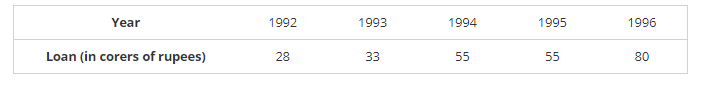
(i) Represent the above data with the help of a bar graph.
(ii) With the help of the bar graph, indicate the year in which amount of loan is not increased over that of the preceding year.
To represent the given data by a vertical bar graph, we first draw horizontal and vertical axes. Let us consider that the horizontal and vertical axes represent the years and the amount of loan in Crores of rupees respectively. We have to draw 5 bars of different lengths given in the table. At first, we mark 5 points in the horizontal axis at equal distances and erect rectangles of the same width at these points. The heights of the rectangles are proportional to the amount of loan disbursed by the bank.
(i) The vertical bar graph of the given data is following:
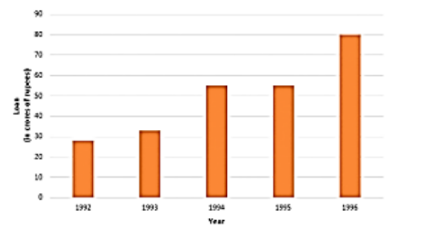
(ii) It is seen from the bar graph that the heights of the bars in the years 1994 and 1995 are same. Hence, the amount of loan is not increased in the year 1995 over the preceding year 1994.
Click here to get exam-ready with eSaral
For making your preparation journey smoother of JEE, NEET and Class 8 to 10, grab our app now.