The following data gives the amount of manure (in thousand tones) manufactured by a company during some years:

The following data gives the amount of manure (in thousand tones) manufactured by a company during some years:
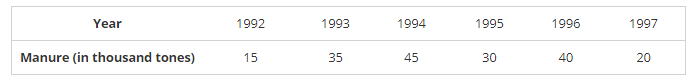
(i) Represent the above data with the help of a bar graph.
(ii) Indicate with the help of the bar graph the year in which the amount of manufactured by the company was maximum.
(iii) Choose the correct alternative:
The consecutive years during which there was the maximum decrease in manure production are:
(a) 1994 and 1995
(b) 1992 and 1993
(c) 1996 and 1997
(d) 1995 and 1996
To represent the given data by a vertical bar graph, we first draw horizontal and vertical axes. Let us consider that the horizontal and vertical axes represent the years and the amount of manure in thousand 9 ones respectively. We have to draw 6 bars of different lengths given in the table. At first, we mark 6 points in the horizontal axis at equal distances and erect rectangles of the same width at these points. The heights of the rectangles are proportional to the amount of manures manufactured by the company.
(i) The vertical bar graph of the given data is following:
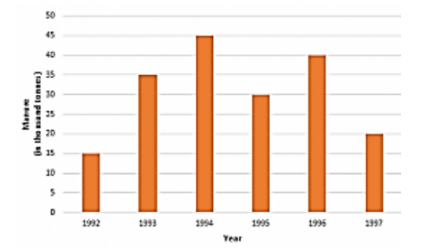
(ii) It is seen from the bar graph that the height of the 3s bar from the left is maximum, which is corresponding to the year 1994. So in 1994, the quantity manufactured by the company was maximum.
(iii) It is seen from the bar graph that the manure production is decreased in the years 1995 (1.5 scale divisions) and 1997 (2 full-scale divisions). So, the maximum decrease is in the year 1997. Hence, the correct choice is (c).
Click here to get exam-ready with eSaral
For making your preparation journey smoother of JEE, NEET and Class 8 to 10, grab our app now.