
The following data gives the demand estimates of the Government of India, Department of Electronics for the personnel in the Computer sector during the Eighth Plan period (1990 – 95):
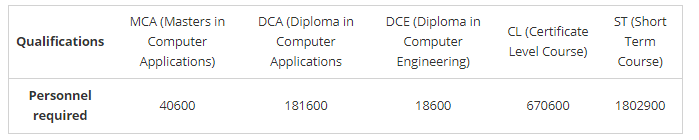
Represent the data with the help of a bar graph. Indicate with the help of the bar graph the course where the estimated requirement is least.
To represent the given data by a vertical bar graph, we first draw horizontal and vertical axes. Let us consider that the horizontal and vertical axes represent the qualifications and the personnel required in hundreds respectively. We have to draw 5 bars of different lengths given in the table. At first, we mark 5 points in the horizontal axis at equal distances and erect rectangles of the same width at these points. The heights of the rectangles are proportional to the number of personnel required.
The vertical bar graph of the given data is following:
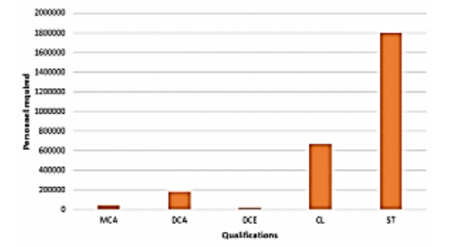
It is seen from the bar graph that the height of the 3ffl bar from the left is least, which is corresponding to DCE. Hence, the requirement is least in DCE.
Click here to get exam-ready with eSaral
For making your preparation journey smoother of JEE, NEET and Class 8 to 10, grab our app now.