
The following data shows the agricultural production in India during a certain year.
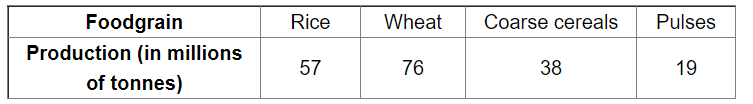
Draw a pie chart to represent the above data.
Total production $=(57+76+38+19)=190$
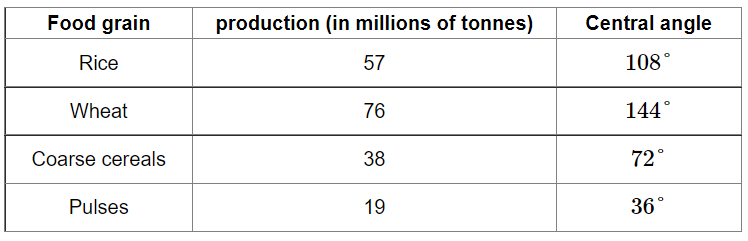
Central angle of each foodgrain $=\left(\frac{\text { production of each foodgrain }}{\text { total production }} \times 360\right)^{\circ}$
Calculation of central angles
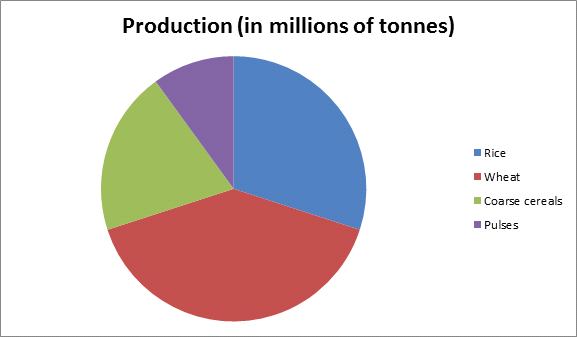
Construction of pie chart
Steps of construction:
1. Draw a circle of any convenient radius.
2. Draw a horizontal radius of the circle.
3. Draw sectors whose central angles are $108^{\circ}, 144^{\circ}, 72^{\circ}$ and $36^{\circ}$.
4. Shade the sectors so obtained differently and label each one of them.
Thus, we obtain the required pie chart as shown in the figure below.
Click here to get exam-ready with eSaral
For making your preparation journey smoother of JEE, NEET and Class 8 to 10, grab our app now.