
The following distribution gives the state-wise teacher-student ratio in higher secondary schools of India. Find the mode and mean of this data. Interpret, the two measures:
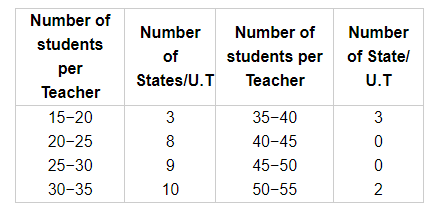
Here, the maximum frequency is 10 so the modal class is 30−35.
Therefore,
$l=30$
$h=5$
$f=10$
$f_{1}=9$
$f_{2}=3$
$\Rightarrow$ Mode $=l+\frac{f-f_{1}}{2 f-f_{1}-f_{2}} \times h$
$=30+\frac{10-9}{20-9-3} \times 5$
$=30+\frac{1}{8} \times 5$
$=30+0.625$
Mode $=30.6$
Thus, the mode of the data is 30.6.
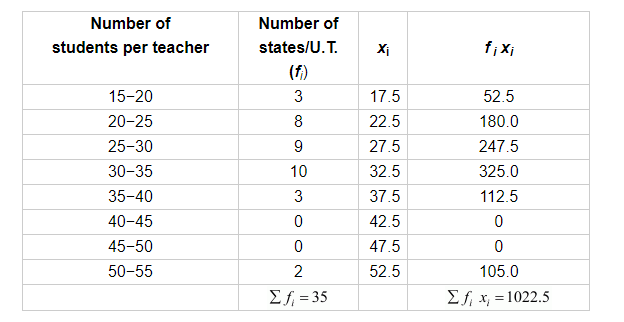
Now,
Mean of the data $=\frac{\sum f_{i} x_{i}}{\sum f_{i}}=\frac{1022.5}{35}=29.2$
Thus, the mean of the data is 29.2.
The mode of the number of students per teacher in the states is more than the mean of the number of students per teacher in the states.
Click here to get exam-ready with eSaral
For making your preparation journey smoother of JEE, NEET and Class 8 to 10, grab our app now.