
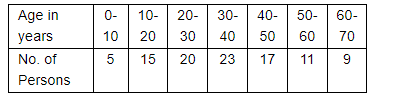
The following table shows the ages of 100 persons of a locality.

Represent the above as the less than type frequency distribution and draw an ogive for the same.
The given frequency distribution is
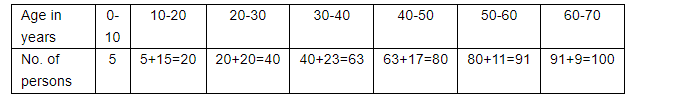
We have to change the above distribution as less than type frequency distribution and also we have to draw its ogive.
We have the following procedure to change the given distribution in to less than type distribution.
=
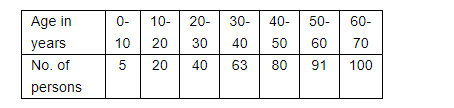
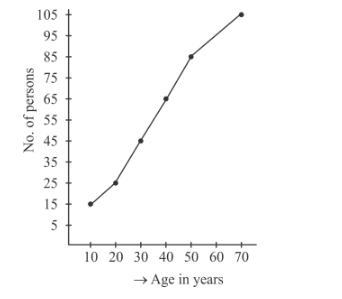
To draw its ogive, take the number of persons on y-axis and age in years on x-axis. Mark the points (10, 5), (20, 20), (30, 40), (40, 63), (50, 80), (60, 91) and (70, 100) on the
xy-plane. Now these points are joined by free hand.
Click here to get exam-ready with eSaral
For making your preparation journey smoother of JEE, NEET and Class 8 to 10, grab our app now.