The following table shows the average daily earnings of 40 general stores in a market, during a certain week.

The following table shows the average daily earnings of 40 general stores in a market, during a certain week.

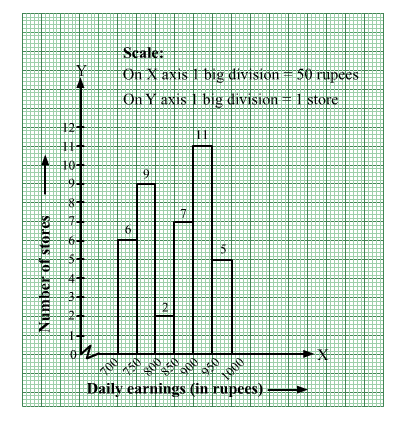
Draw a histogram to represent the above data.
The given frequency distribution is in exclusive form.
We will represent the class intervals [daily earnings (in rupees)] along the x-axis & the corresponding frequencies [number of stores] along the y-axis.
The scale is as follows:
On x-axis: 1 big division = 50 rupees
On y-axis: 1 big division = 1 store
Because the scale on the x-axis starts at 700, a kink, i.e., a break is indicated near the origin to signify that the graph is drawn with a scale beginning at 700 and not at the origin.
We will construct rectangles with the class intervals as bases and the corresponding frequencies as heights.
Thus, we will obtain the following histogram:
Click here to get exam-ready with eSaral
For making your preparation journey smoother of JEE, NEET and Class 8 to 10, grab our app now.