
Question:
The graph which depicts the results of Rutherford gold foil
experiment with
$\alpha$-particles is:
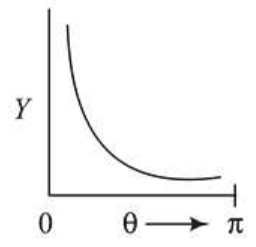
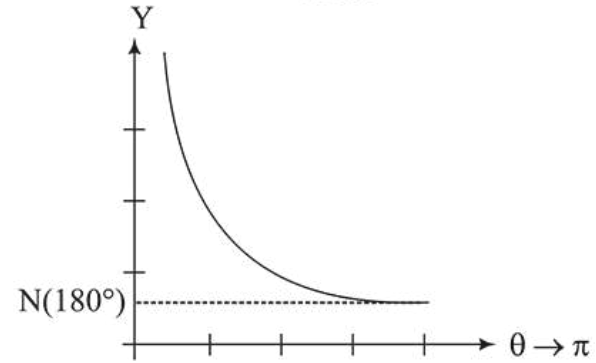
$\theta$ : Scattering angle
$Y$ : Number of scattered $\alpha$-particles detected
(Plots are schematic and not to scale)
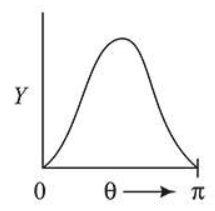
(1)
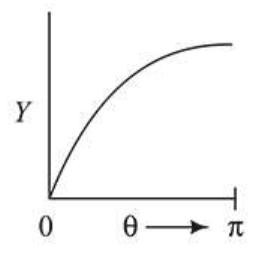
(2)
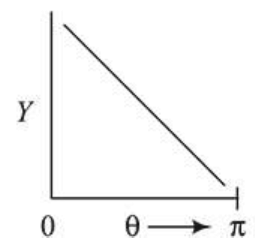
(3)
(4)
Correct Option: , 4
Solution:
(4
)As per Rutherford $\alpha$-particle scattering experiment, number of $\alpha$-particles scattered $(N)$ related with deflection angle $\theta$ as
$N \propto \frac{1}{\sin ^{4} \frac{\theta}{2}}$ i.e. $Y \propto \frac{1}{\sin ^{4}\left(\frac{\theta}{2}\right)}$
$\therefore$ Corresponding $Y_{\text {versus }} \theta$ graph is as shown below.
Click here to get exam-ready with eSaral
For making your preparation journey smoother of JEE, NEET and Class 8 to 10, grab our app now.