
Question:
The plot that depicts the behavior of the mean free time $\tau$ (time between two successive collisions) for the molecules of an ideal gas, as a function of temperature $(T)$, qualitatively, is: (Graphs are schematic and not drawn to scale)
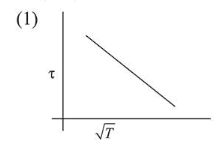
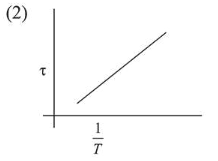
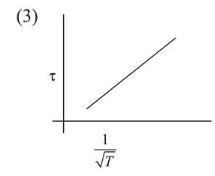
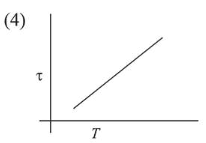
Correct Option: , 3
Solution:
(3) Relaxation time $(\tau) \propto \frac{\text { mean free path }}{\text { speed }} \Rightarrow \tau \propto \frac{1}{\mathrm{~V}}$
and, $v \propto \sqrt{T}$
$\therefore \tau \propto \frac{1}{\sqrt{T}}$
Hence graph between $\tau \mathrm{v} / \mathrm{s} \frac{1}{\sqrt{T}}$ is a straight line
which is correctly depicted by graph shown in option (3).
Click here to get exam-ready with eSaral
For making your preparation journey smoother of JEE, NEET and Class 8 to 10, grab our app now.