
Question:
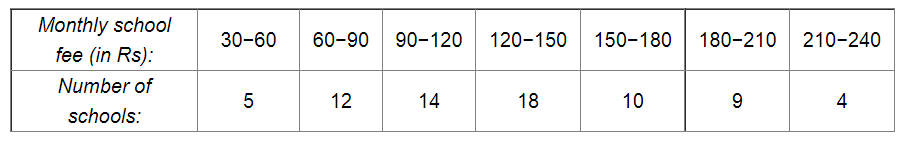
Construct a histogram for the following data:
Solution:
The class limits are represented along the x-axis and the frequencies along the y-axis on a suitable scale. Taking class intervals as bases and corresponding frequencies as heights of the rectangles, the histogram of the given data can be obtained as shown in the figure below:.png)
Click here to get exam-ready with eSaral
For making your preparation journey smoother of JEE, NEET and Class 8 to 10, grab our app now.