
Draw the temperature-time graph in each of the following cases:
(i)
| Time (in hours): | 7:00 | 9:00 | 11:00 | 13:00 | 15:00 | 17:00 | 19:00 | 21:00 |
| Temperature (°F) in: | 100 | 101 | 104 | 102 | 100 | 99 | 100 | 98 |
(ii)
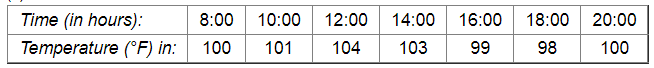
Here, time is an independent variable and temperature is a dependent variable. So, we take time on the x-axis and temperature on the y-axis.
Let us choose the following scale:
For point (i):
On x-axis: 1 cm = 1 hours
On y-axis: 1 cm = 2οF
For point (ii):
On x-axis: 2 cm = 2 hours
On y-axis: 1 cm = 1οF
Let us assume that on the x-axis, the coordinate of origin is 6:00.
On y-axis, the coordinate of origin is 94οF .
So, the coordinates of O are (6:00, 94).
Now, let us plot (7:00, 100), (9:00, 101), (11:00, 104),..(21:00, 98) for point (i) and (8:00, 100), (10:00, 101), (12:00, 104),...,(20:00, 100) for point (ii). These points are joined to get the graphs representing the given information as shown in the figures below.
(i).png)
(ii).png)
Click here to get exam-ready with eSaral
For making your preparation journey smoother of JEE, NEET and Class 8 to 10, grab our app now.