Draw the graphs of the lines x – y = 1 and 2x + y = 8. Shade the area formed by these two lines and the y-axis.

Draw the graphs of the lines x – y = 1 and 2x + y = 8. Shade the area formed by these two lines and the y-axis. Also, find this area.
$x-y=1$
$\Rightarrow y=x-1$
When $x=0, y=0-1=-1$
When $x=1, y=1-1=0$
When $x=2, y=2-1=1$
Thus, the points on the line x – y = 1 are as given in the following table:
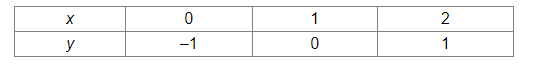
Plotting the points (0, –1), (1, 0) and (2, 1) and drawing a line passing through these points, we obtain the graph of of the line x – y = 1.
$2 x+y=8$
$\Rightarrow y=-2 x+8$
When $x=1, y=-2 \times 1+8=-2+8=6$
When $x=2, y=-2 \times 2+8=-4+8=4$
When $x=3, y=-2 \times 3+8=-6+8=2$
Thus, the points on the line 2x + y = 8 are as given in the following table:
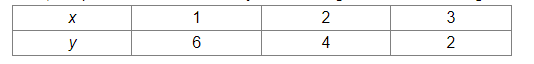
Plotting the points (1, 6), (2, 4) and (3, 2) and drawing a line passing through these points, we obtain the graph of of the line 2x + y = 8.
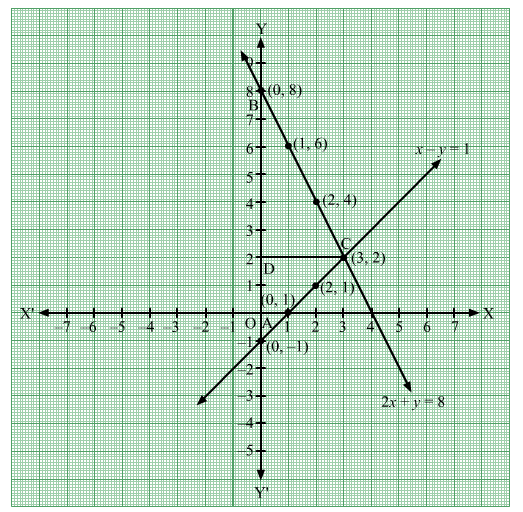
The shaded region represents the area bounded by the lines x – y = 1, 2x + y = 8 and the y-axis. This represents a triangle.
It can be seen that the lines intersect at the point C(3, 2). Draw CD perpendicular from C on the y-axis.
Height = CD = 3 units
Base = AB = 9 units
$\therefore$ Area of the shaded region $=$ Area of $\Delta \mathrm{ABC}=\frac{1}{2} \times \mathrm{AB} \times \mathrm{CD}=\frac{1}{2} \times 9 \times 3=\frac{27}{2}$ square units
Click here to get exam-ready with eSaral
For making your preparation journey smoother of JEE, NEET and Class 8 to 10, grab our app now.