
Question.
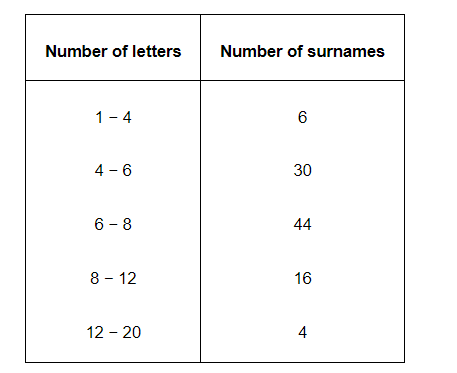
100 surnames were randomly picked up from a local telephone directory and a frequency distribution of the number of letters in the English alphabet in the surnames was found as follows:
(i) Draw a histogram to depict the given information.
(ii) Write the class interval in which the maximum number of surname lie.
Solution:
(i) Here, it can be observed that the data has class intervals of varying width. The proportion of the number of surnames per 2 letters interval can be calculated as follows.
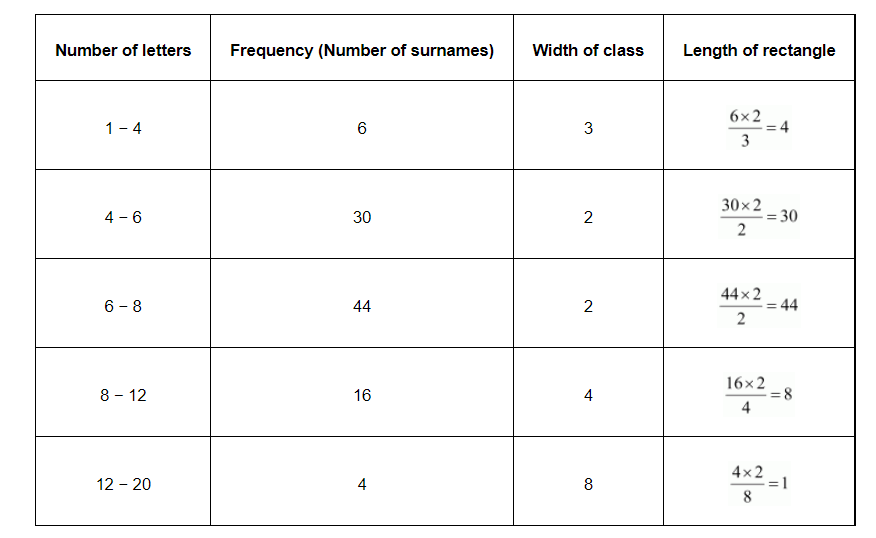
By taking the number of letters on x-axis and the proportion of the number of surnames per 2 letters interval on y-axis and choosing an appropriate scale (1 unit = 4 students for y axis), the histogram can be constructed as follows.
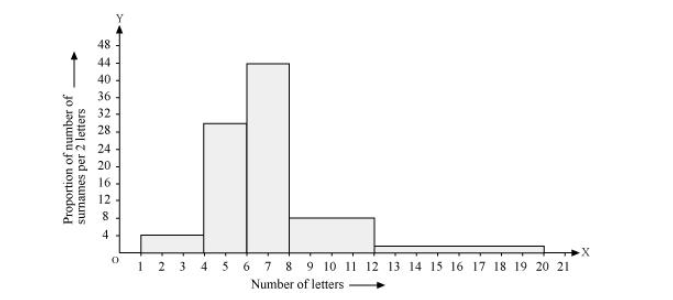
(ii) The class interval in which the maximum number of surnames lies is 6 − 8 as it has 44 surnames in it i.e., the maximum for this data.
(i) Here, it can be observed that the data has class intervals of varying width. The proportion of the number of surnames per 2 letters interval can be calculated as follows.
By taking the number of letters on x-axis and the proportion of the number of surnames per 2 letters interval on y-axis and choosing an appropriate scale (1 unit = 4 students for y axis), the histogram can be constructed as follows.
(ii) The class interval in which the maximum number of surnames lies is 6 − 8 as it has 44 surnames in it i.e., the maximum for this data.
Click here to get exam-ready with eSaral
For making your preparation journey smoother of JEE, NEET and Class 8 to 10, grab our app now.