
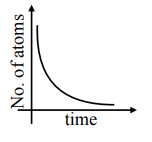
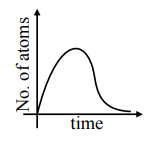
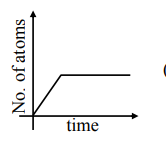
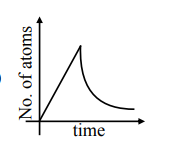
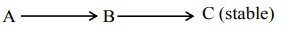
A sample of a radioactive nucleus A disintegrates to another radioactive nucleus $B$, which in turn disintegrates to some other stable nucleus C. Plot of a graph showing the variation of number of atoms of nucleus B vesus time is :
(Assume that at $\mathrm{t}=0$, there are no $\mathrm{B}$ atoms in the sample)
Correct Option: , 2
Initially no. of atoms of $\mathrm{B}=0$ after $\mathrm{t}=0$, no. of atoms of $B$ will starts increasing \& reaches maximum value when rate of decay of $B=$ rate of formation of $B$.
After that maximum value, no. of atoms will starts decreasing as growth \& decay both are exponential functions, so best possible graph is (2) Option (2)
Click here to get exam-ready with eSaral
For making your preparation journey smoother of JEE, NEET and Class 8 to 10, grab our app now.