A study was conducted to find out the concentration of sulphur dioxide in the air in parts per million (ppm) of a certain city.

Question.
A study was conducted to find out the concentration of sulphur dioxide in the air in parts per million (ppm) of a certain city. The data obtained for 30 days is as follows:
0.03 0.08 0.08 0.09 0.04 0.17
0.16 0.05 0.02 0.06 0.18 0.20
0.11 0.08 0.12 0.13 0.22 0.07
0.08 0.01 0.10 0.06 0.09 0.18
0.11 0.07 0.05 0.07 0.01 0.04
(i) Make a grouped frequency distribution table for this data with class intervals as 0.00 - 0.04, 0.04 - 0.08, and so on.
(ii) For how many days, was the concentration of sulphur dioxide more than 0.11 parts per million?
Solution:
Taking class intervals as 0.00, −0.04, 0.04, −0.08, and so on, a grouped frequency table can be constructed as follows.
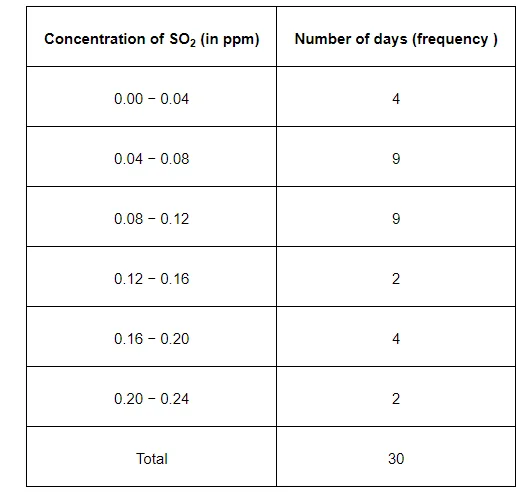
The number of days for which the concentration of $\mathrm{SO}_{2}$ is more than $0.11$ is the number of days for which the concentration is in between $0.12-0.16,0.16-0.20,0.20-0.24$.
Required number of days = 2 + 4 + 2 = 8
Therefore, for 8 days, the concentration of $\mathrm{SO}_{2}$ is more than $0.11 \mathrm{ppm}$.
Taking class intervals as 0.00, −0.04, 0.04, −0.08, and so on, a grouped frequency table can be constructed as follows.
The number of days for which the concentration of $\mathrm{SO}_{2}$ is more than $0.11$ is the number of days for which the concentration is in between $0.12-0.16,0.16-0.20,0.20-0.24$.
Required number of days = 2 + 4 + 2 = 8
Therefore, for 8 days, the concentration of $\mathrm{SO}_{2}$ is more than $0.11 \mathrm{ppm}$.