
Question:
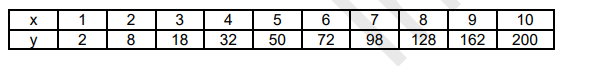
Draw a graph from the following data. Draw tangents at $x=2,4,6$ and 8 . Find the slopes of these tangents. Verify that the curve is drawn is $\mathrm{y}=2 \mathrm{x}^{2}$ and the slope of tangent is $\tan \theta=\frac{d y}{d x}=4 x$.
Solution:
To find the slope at any point, we draw a tangent and we extend it to meet the $X$ axis. Then we can find $\theta$ as shown in the figure.
We can use another way, which is by differentiation. We write,
$\frac{d y}{d x}=\frac{d}{d x}\left(2 x^{2}\right)=4 x$
Click here to get exam-ready with eSaral
For making your preparation journey smoother of JEE, NEET and Class 8 to 10, grab our app now.