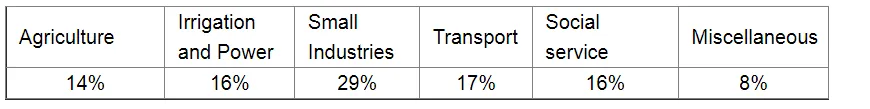
Draw a pie-diagram for the following data of the investment pattern in a five year plan:

Draw a pie-diagram for the following data of the investment pattern in a five year plan:
We know:
Central angle of a component $=\left(\right.$ component value $/$ sum of component values $\left.\times 360^{\circ}\right)$
Here the total percentage = 100%
Thus, the central angle for each component can be calculated as follows:
| Item | Amount (in %) |
Sector angle |
| Agriculture | 14 | 14/100 x 360 = 50.4 |
| Irrigation and Power | 16 | 16/100 x 360 = 57.6 |
| Small Industries | 29 | 29/100 x 360 =104.4 |
| Transport | 17 | 17/100 x 360 = 61.2 |
| Social Service | 16 | 16/100 x 360 =57.6 |
| Miscellaneous | 8 | 8/100 x 360 = 28.8 |
Now, the pie chat representing the given data can be constructed by following the steps below:
Step 1 : Draw circle of an appropriate radius.
Step 2 : Draw a vertical radius of the circle drawn in step 1.
Step 3 : Choose the largest central angle. Here the largest central angle is 104.4o. Draw a sector with the central angle 104.4o in such a way that one of its radii coincides with the radius drawn in step 2 and another radius is in its counter clockwise direction.
Step 4 : Construct the other sectors representing the other items in the clockwise sense in descending order of magnitudes of their central angles.
Step 5 : Shade the sectors with different colours and label them as shown in the figure below..webp)