Draw an ogive by less than method for the following data:

Question:
Draw an ogive by less than method for the following data:

Solution:
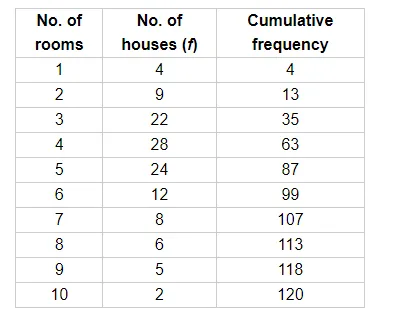
Firstly, we prepare the cumulative frequency table by less than method.
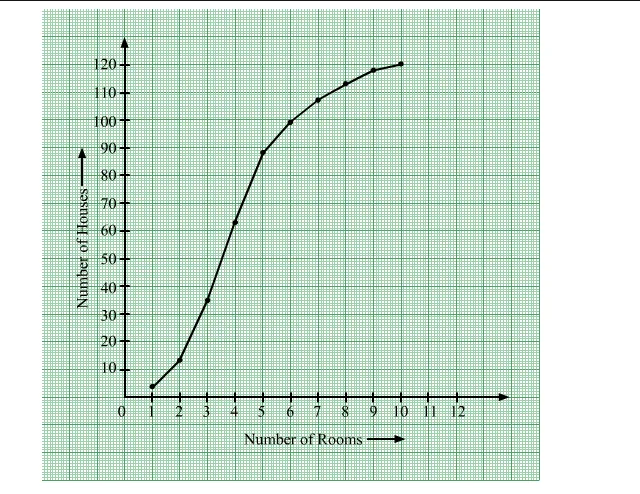
Now, plot the less than ogive using the points (1, 4), (2, 13), (3, 35), (4, 63), (5, 87), (6, 99), (7, 107), (8, 113), (9, 118) and (10, 120).