Figure 2.23 show the graph of the polynomial

Question:
Figure $2.23$ show the graph of the polynomial $f(x)=a x^{2}+b x+c$ for which
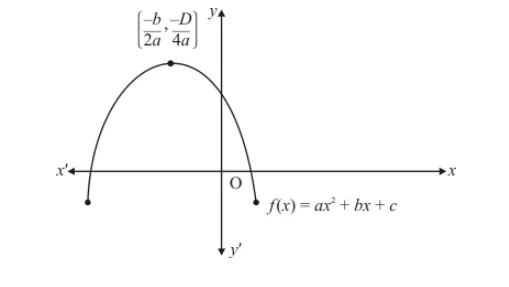
(a) $a<0, b>0$ and $c>0$
(b) $a<0, b<0$ and $c>0$
(c) $a<0, b<0$ and $c<0$
(d) $a>0, b>0$ and $c<0$
Solution:
Clearly, $f(x)=a x^{2}+b x+c$ represent a parabola opening downwards. Therefore, $a<0$
$y=a x^{2}+b x+c$ cuts $y$-axis at $\mathrm{P}$ which lies on $O Y$. Putting $x=0$ in $y=a x^{2}+b x+c$, we get $y=c$. So the coordinates $\mathrm{P}$ are $(0, c)$. Clearly, $P$ lies on $O Y$. Therefore $c>0$
The vertex $\left(\frac{-b}{2 a}, \frac{-D}{4 a}\right)$ of the parabola is in the second quadrant. Therefore $\frac{-b}{2 a}<0, b<0$
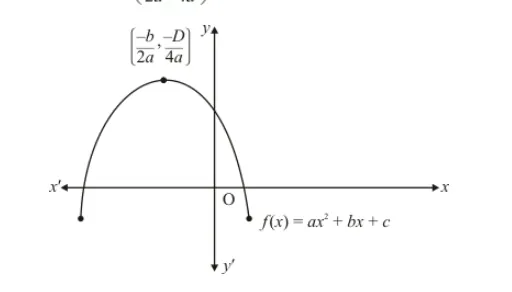
Therefore $a<0, b<0$, and $c>0$
Hence, the correct choice is (b)