Question.
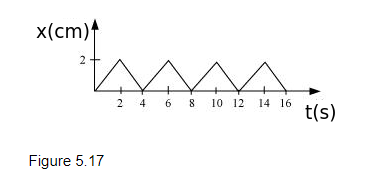
Figure 5.17 shows the position-time graph of a body of mass 0.04 kg. Suggest a suitable physical context for this motion. What is the time between two consecutive impulses received by the body? What is the magnitude of each impulse?

Figure 5.17 shows the position-time graph of a body of mass 0.04 kg. Suggest a suitable physical context for this motion. What is the time between two consecutive impulses received by the body? What is the magnitude of each impulse?

solution:
A ball rebounding between two walls located between at $x=0$ and $x=2 \mathrm{~cm}$; after every $2 \mathrm{~s}$, the ball receives an impulse of magnitude $0.08 \times 10^{-2} \mathrm{~kg} \mathrm{~m} / \mathrm{s}$ from the walls
The given graph shows that a body changes its direction of motion after every 2 s. Physically, this situation can be visualized as a ball rebounding to and fro between two stationary walls situated between positions x = 0 and x = 2 cm. Since the slope of the x-t graph reverses after every 2 s, the ball collides with a wall after every 2 s. Therefore, ball receives an impulse after every 2 s.
Mass of the ball, m = 0.04 kg
The slope of the graph gives the velocity of the ball. Using the graph, we can calculate initial velocity (u) as:
$u=\frac{(2-0) \times 10^{-2}}{(2-0)}=10^{-2} \mathrm{~m} / \mathrm{s}$
Velocity of the ball before collision, $u=10^{-2} \mathrm{~m} / \mathrm{s}$
Velocity of the ball after collision, $v=-10^{-2} \mathrm{~m} / \mathrm{s}$
(Here, the negative sign arises as the ball reverses its direction of motion.)
Magnitude of impulse = Change in momentum
$=|m v-m u|$
$=|0.04(v-u)|$
$=\left|0.04\left(-10^{-2}-10^{-2}\right)\right|$
$=0.08 \times 10^{-2} \mathrm{~kg} \mathrm{~m} / \mathrm{s}$
Click here to get exam-ready with eSaral
For making your preparation journey smoother of JEE, NEET and Class 8 to 10, grab our app now.
