Following is the break up of the expenditure of a family on different items of consumption:

Following is the break up of the expenditure of a family on different items of consumption:
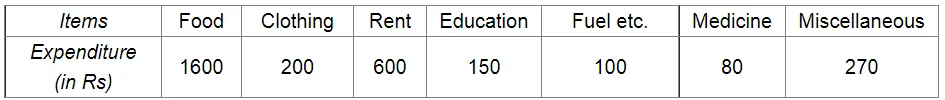
Draw a pie-diagram to represent the above data.
We know:
Central angle of a component $=\left(\right.$ component value $/$ sum of component values $\left.\times 360^{\circ}\right)$
Here, total expenditure = Rs 3000
Thus, central angle for each component can be calculated as follows:
| Item | Expenditure (in Rs) | Sector angle |
| Food | 1600 | 1600/3000 × 360 = 192 |
| Clothing | 200 | 200/3000 × 360 = 24 |
| Rent | 600 | 600/3000 × 360 = 72 |
| Education | 150 | 150/3000× 360 = 18 |
| Fuel etc | 100 | 100/3000 × 360 = 12 |
| Medicine | 80 | 80/3000 × 360 = 9.6 |
| Miscellaneous | 270 | 270/3000 × 360 = 32.4 |
Total : 3000 (in Rs)
Now, the pie chat representing the given data can be constructed by following the steps below:
Step 1 : Draw a circle of an appropriate radius.
Step 2 : Draw a vertical radius of the circle drawn in step 1.
Step 3 : Choose the largest central angle. Here, the largest central angle is 192o. Draw a sector with the central angle 192o in such a way that one of its radii coincides with the radius drawn in step 2 and another radius is in its counter clockwise direction.
Step 4 : Construct other sectors representing the other items in the clockwise sense in descending order of magnitudes of their central angles.
Step 5 : Shade the sectors with different colours and label them as shown in the figure below..webp)