Given below is a pie chart showing the time

Given below is a pie chart showing the time spend by a group of 350 children in different games. Observe it and answer the questions that follow.
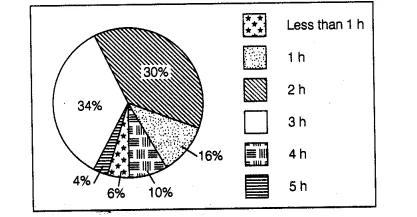
(a) How many children spend atleast one hour in playing games?
(b) How many children spend more than 2 h in playing games?
(c) How many children spend 3 or lesser hours in playing games?
(d) Which is greater, number of children who spend 2 hours or more per . day or number of children who play for less than one hour?
(a) Number of children who spend atleast 1 h in playing games i.e. the number of children playing 1 h or more than 1 h
= (Total number of children) – (Number of children spend less than 1 h)
= 350-6% of 350
$=350-\frac{6}{100} \times 350$
= 350 – 21 = 329
(b) Number of children who spend more than 2 h in playing games
= (34 + 10 + 4)%of the total number of students
= 48% of 350
$=48 \times 350=168$
(c) Number of children who spend 3 or lesser hours in playing games
= (34 + 30 + 16 + 6)% of total number of students
= 86% of 350
$=\frac{86}{100} \times 350=301$
(d) Number of children who spend 2 h or more per day in playing games
= (30 + 34 + 10 + 4)% of total number of students = 78% of total number of students
Number of children who spend less than one hour = 6% of total number of students
Clearly, number of children who play for 2 h or more per day is greater than the number of children who play for less than 1 h.