
Question:
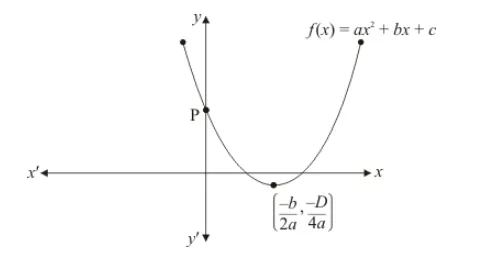
If the diagram in Fig. $2.22$ shows the graph of the polynomial $f(x)=a x^{2}+b x+c$, then
(a) $a>0, b<0$ and $c>0$
(b) $a<0, b<0$ and $c<0$
(c) $a<0, b>0$ and $c>0$
(d) $a<0, b>0$ and $c<0$
Solution:
Clearly, $f(x)=a x^{2}+b x+c$ represent a parabola opening upwards.
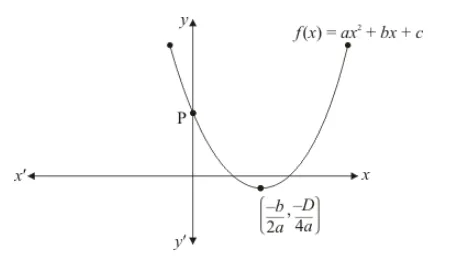
Therefore, $a>0 \quad y=a x^{2}+b x+c$ cuts $Y$ axis at $P$ which lies on $O Y$. Putting $x=0$ in $y=a x^{2}+b x+c$, we get $y=c$. So the coordinates of $P$ is $(0, c)$. Clearly, $\mathrm{P}$ lies on $O Y$. Therefore $c>0$
Hence, the correct choice is $(a)$