
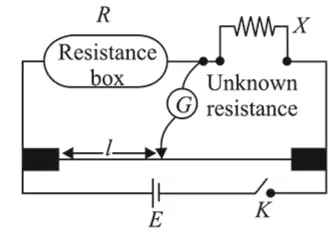
In a meter bridge experiment, the circuit diagram and the corresponding observation table are shown in figure.
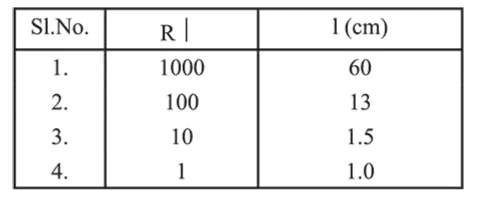
Which of the reading is consistent?
Correct Option: , 3
(3) For a balanced bridge
$\frac{\mathrm{R}_{1}}{\mathrm{R}_{2}}=\frac{l_{2}}{l_{1}}$
So $\frac{\mathrm{R}}{\mathrm{X}}=\frac{l}{100-l}$
Using the above expression
$\mathrm{X}=\frac{\mathrm{R}(100-l)}{l}$
for observation (1) $\mathrm{X}=\frac{100 \times 40}{60}=\frac{2000}{3} \Omega$
for observation (2) $X=\frac{100 \times 87}{13}=\frac{8700}{13} \Omega$
for observation (3) $\mathrm{X}=\frac{10 \times 98.5}{1.5}=\frac{1970}{3} \Omega$
for observation (4) $\mathrm{X}=\frac{1 \times 99}{1}=99 \Omega$
Clearly we can see that the value of $x$ calculated in observation (4) is inconsistent than other.