
Question:
In a study of diabetic patients in a village, the following observations were noted.

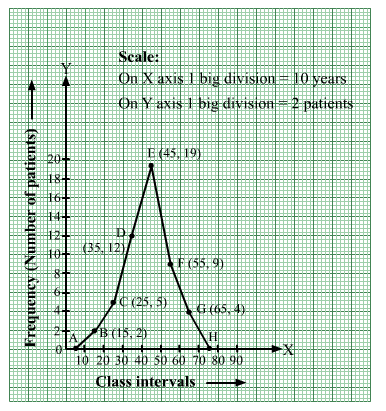
Represent the above data by a frequency polygon.
Solution:
We take two imagined classes—one at the beginning (0–10) and other at the end (70–80)—each with frequency zero.
With these two classes, we have the following frequency table:
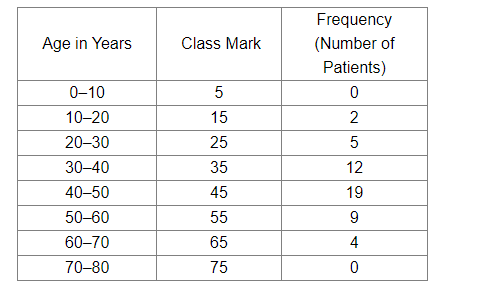
Now, we plot the following points on a graph paper:
A(5, 0), B(15, 2), C(25, 5), D(35, 12), E(45, 19), F(55, 9), G(65, 4) and H(75, 0)
Join these points with line segments AB, BC, CD, DE, EF, FG, GH ,HI and IJ to obtain the required frequency polygon.
Comments
Click here to get exam-ready with eSaral
For making your preparation journey smoother of JEE, NEET and Class 8 to 10, grab our app now.