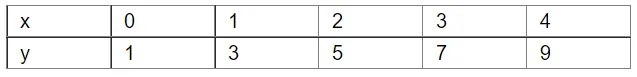
Plot a line graph for the variables x and y , where y = 2x + 1.
Using the graph, find the value of (i) y, when x = 5 and (ii) x, when y = 13.
We have the following table for y = 2x+1
Leave a comment
All Study Material
.webp)
