Read the bar graph given in figure and answer the following questions:

Read the bar graph given in figure and answer the following questions:
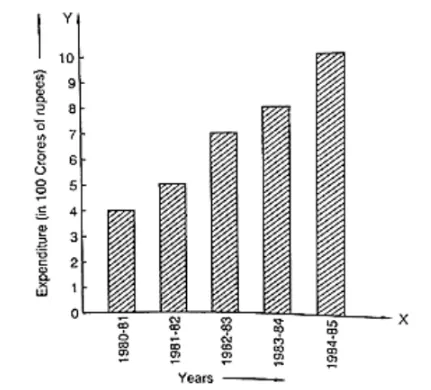
(i) What information is given by the bar graph?
(ii) What was the expenditure on health and family planning in the year 1982-83?
(iii) In which year is the increase in expenditure maximum over the expenditure in the previous year? What is the maximum increase?
(i) The bar graph represents the expenditure (in 100 Crores of rupees) on health and family planning during the Sixth Five Year Plan in India.
(ii) The height of the 2nd bar from the left is 7 units, which is corresponding to the year 1982 – 83. Hence, the expenditure on health and family planning in the year 1982 – 83 was 700 Crores rupees.
(iii) Take the year 1980-81 as the initial year of expenditure. Then:
(a) The increase in expenditure in the year 1981- 82 is 5- 4 = 1 unit
(b) The increase in expenditure in the year 1982 – 83 is 7 - 5 = 2 units.
(c) The increase in expenditure in the year 1983 – 84 is 8 - 7 = 1 unit
(d) The increase in expenditure in the year 1984 – 85 is 10.2 - 8 = 2.2 units.
Hence, in the year 1984 – 85 the increase in expenditure is the maximum and the maximum increase is 2.2 × 100 = 220 Cores rupees