
Read the bar graph given in figure and answer the following questions:
(i) What is the information given by the bar graph?
(ii) What is the number of families having 6 members?
(iii) How many members per family are there in the maximum number of families? Also tell the number of such families.
(iv) What are the number of members per family for which the number of families are equal? Also, tell the number of such families?
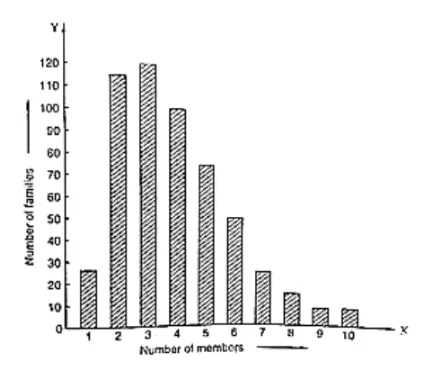
(i) The bar graph represents the number of families with the different number of members in a locality.
(ii) The number of families having 6 members is 50, the height of the 6th bar from the left.
(iii) The maximum number of families is 120. There are 3 members per family in the maximum number of families.
(iv) It is seen from the bar graph that the height of the 9th and 10th bars from the left are same (equals to 5). Hence, the numbers of members per family for which the number of families are equal are 9 and 10. The number of such families is 5.