
Read the bar graph shown in the figure and answer the following questions:
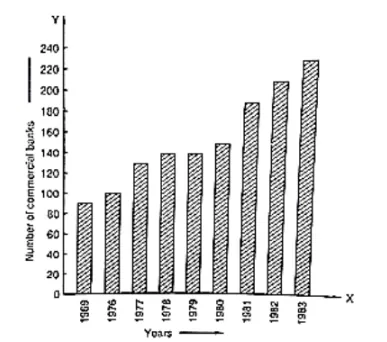
(i) What is the information given by the bar graph?
(ii) What was the number of commercial banks in 1977?
(iii) What is the ratio of the number of commercial banks in 1969 to that in 1980?
(iv) State whether true or false:
The number of commercial banks in 1983 is less than double the number of commercial banks in 1969.
(i) The bar graph represents the number of commercial banks in India during some particular years.
(ii) The number of commercial banks in 1977 was
120 + (140 – 120)/2
⟹ 120 + 20/2
⟹ 120 + 10
⟹ 130
(iii) The number of commercial banks in 1969 was
80 + (100 – 80)/2
⟹ 80 + 20/2
⟹ 80 + 10
⟹ 90
The number of commercial banks in 1980 was
140 + (160 -140)/ 2
⟹ 140 +20/2
⟹ 140 + 10
= 150
Hence, the required ratio is 90/150
⟹ 3/5
⟹ 3:5
(iv) The number of commercial banks in 1983 was
220 + (240 – 220)/ 2
⟹ 220 + 20/2
⟹ 220 + 10
⟹ 230
The number of commercial banks in 1969 was 90.
When we multiply this number by 2, it becomes 2 × 90 = 180
Clearly, 230 is not less than 180. Hence the statement is false.