
Read the bar graph shown in the figure and answer the following questions:
(i) What is the information given by the bar graph?
(ii) How many tickets of Assam State Lottery were sold by the agent?
(iii) Of which state, were the maximum number of tickets sold?
(iv) State whether true or false.
The maximum number of tickets sold is three times the minimum number of tickets sold.
(v) Of which state were the minimum numbers of tickets sold?
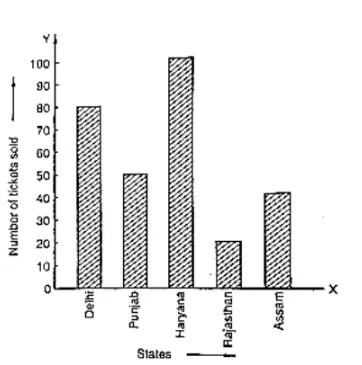
(i) The bar graph represents the number of tickets of different state lotteries sold by an agent on a day.
(ii) The number of tickets of Assam State Lottery were sold by the agent is 40.
(iii) The maximum numbers of tickets were sold is 100, in the state Haryana
(iv) The maximum number of tickets were sold is 100, in the state Haryana the minimum number of tickets were sold is 20, in the state Rajasthan. It is clear that 100 are equal to the 5 times of 20. Hence, the statement is false.
(v) The minimum numbers of tickets were sold is 20, in the state Rajasthan.