Read the graph given in figure and answer the following question

Read the graph given in figure and answer the following question
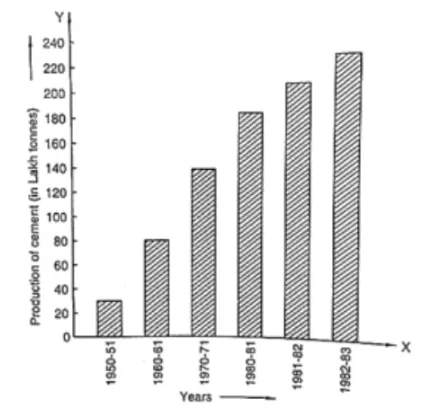
(i) What information is given by the bar given?
(ii) In which years the areas under the sugarcane crop were the maximum and the minimum?
(iii) State whether true or false:
The area under sugarcane crop in the year 1982 – 83 is three times that of the year 1950 – 51.
(i) The bar graph represents the areas (in lath hectares) under sugarcane crop during different years in India.
(ii) It is seen from the bar graph that the area under the sugarcane crop is maximum in the year 1982 – 83 and minimum in the year 1950 – 51.
(iii) The area under the sugarcane crop in the years 1982 – 83 and 1950 - 51 are 34 lakh hectares and 18 lakh hectares respectively. Clearly, 34 is not equal to 3 multiplied by 18. Hence, the statement is false.