Study the bar graph representing the number of persons in various age groups in a town shown in figure Observe the bar graph and answer the following questions:

Study the bar graph representing the number of persons in various age groups in a town shown in figure Observe the bar graph and answer the following questions:
(i) What is the percentage of the youngest age-group persons over those in the oldest age group?
(ii) What is the total population of the town?
(iii) What is the number of persons in the age-group 60 – 65?
(iv) How many persons are more in the age-group 10 – 15 than in the age group 30 – 35?
(v) What is the age-group of exactly 1200 persons living in the town?
(vi) What is the total number of persons living in the town in the age-group 50 – 55?
(vii) What is the total number of persons living in the town in the age-groups 10 – 15 and 60 – 65?
(vii) Whether the population in general increases, decreases or remains constant with the increase in the age-group.
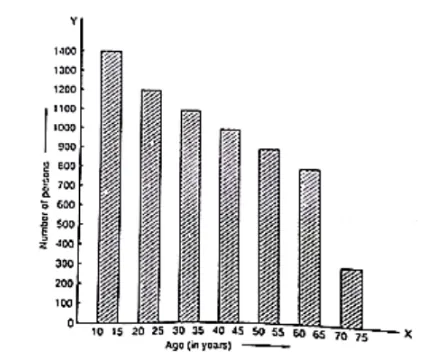
(i) The youngest age-group is 10-15 years. The number of persons belonging to this group is 1400. The oldest age-group is 70-75 years. The number of persons belonging to this group is 300. The percentage of youngest age-group persons over those in the oldest group is
$\frac{1400}{300} \times 100$
$=\frac{1400}{3}$
$=466 \frac{2}{3}$
(ii) The population of the town is 300 + 800 + 900 + 1000 + 1100 + 1200 + 1400 = 6700
(iii) The number of persons in the age group 60 – 65 is 800.
(iv) The number of persons in the age group 10 – 15 is 1400 and the number of persons in the age group 30 – 35 is 1100. Hence the number of more persons in the age group 10 – 15 than the group 30 – 35 is 1400 – 1100 = 300.
(v) The age group of 1200 persons living in the town is 20 – 25.
(vi) The total number of persons living in the town in the age-group 50 – 55 is 900.
(vii) The total number of persons living in the town in the age-groups 10 -15 and 60 – 65 is 1400 + 800 = 2200.
(viii) It is shown from the bar graph that the height of the bars decreases as the age-group increases. Hence, the population decreases with the increases in the age-group.