The above frequency distribution table represents the blood groups of 30 students of a class.

Question.
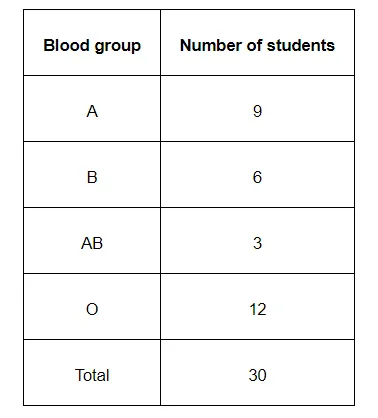
The above frequency distribution table represents the blood groups of 30 students of a class. Use this table to determine the probability that a student of this class, selected at random, has blood group AB.
The above frequency distribution table represents the blood groups of 30 students of a class. Use this table to determine the probability that a student of this class, selected at random, has blood group AB.
Solution:
Number of students having blood group AB = 3
Total number of students = 30
Hence, required probability, $\mathrm{P}=\frac{3}{30}=\frac{1}{10}$
Number of students having blood group AB = 3
Total number of students = 30
Hence, required probability, $\mathrm{P}=\frac{3}{30}=\frac{1}{10}$