
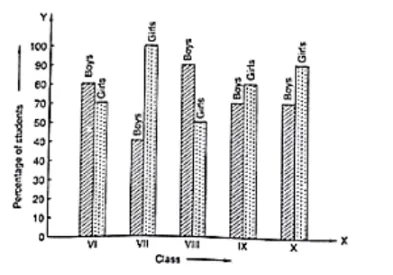
The following bar graph shows the results of an annual examination in a secondary school. Read the bar graph and choose the correct alternative in each of the following:
(i) The pair of classes in which the results of boys and girls are inversely proportional are:
(a) VI, VIII
(b) VI, IX
(c) VII, IX
(d) VIII, X
(ii) The class having the lowest failure rate of girls is:
(a) VI
(b) X
(c) IX
(d) VIII
(iii) The class having the lowest pass rate of students is:
(a) VI
(b) VII
(c) VIII
(d) IX
(i) The pair of classes in which the results of boys and girls are inversely proportional are VI and IX.
(ii) The lowest failure rate of girls is same to the highest pass rate. Hence, the class having the lowest failure rate of girls is VII (the height of the bar corresponding to girls for this class is maximum).
(iii) The sum of the heights of the bars for boys and girls in class VII is minimum, which is 95 + 40 = 135. Hence, the class having the lowest pass rate is VII. Hence, the correct choice is (b).