The following data gives the value (in crores of rupees) of the Indian export of cotton textiles for different years:

The following data gives the value (in crores of rupees) of the Indian export of cotton textiles for different years:
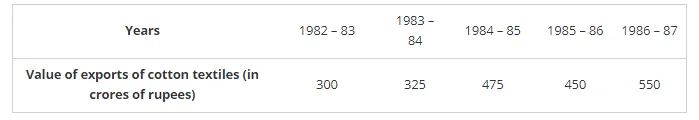
Represent the above data with the help of a bar graph. Indicate with the help of a bar graph the year in which the rate of increase in exports is maximum over the preceding year.
To represent the given data by a vertical bar graph, we first draw horizontal and vertical axes. Let us consider that the horizontal and vertical axes represent the years and the value of Indian export of cotton textiles in Crores of rupees respectively. We have to draw 5 bars of different lengths given in the table.
At first, we mark 5 points in the horizontal axis at equal distances and erect rectangles of the same width at these points. The heights of the rectangles are proportional to the values of Indian export of cotton textiles in different years. The vertical bar graph of the given data is following:
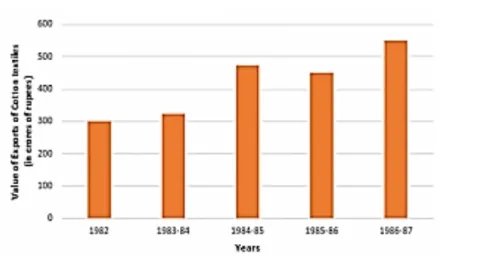
The export increases in the years 1983 – 84, 1984 – 85 and 1986 – 87. Now,
(a) The rate of increase in the year 1983 – 84 is
$\Rightarrow \frac{325-300}{300} \times 100$
⟹ 25/3
= 8.33%
(b) The rate of increase in the year 1984 – 85 is
$\Rightarrow \frac{475-325}{325} \times 100$
⟹ 15000/325
⟹ 600/13
⟹ 46.15%
(c) The rate of increase in the year 1986 – 87 is
$\Rightarrow \frac{550-450}{450} \times 100$
⟹ 10000 /450
⟹ 22.22%
Hence, in the year 1984-85, the rate of increase of export is the maximum over the preceding year.