
Question:
The following histogram shows the frequency distribution of teaching experiences of 30 teachers in various schools:
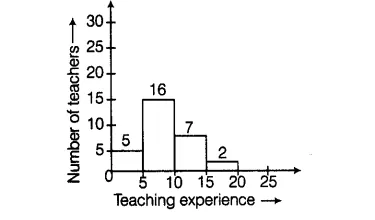
(a) What is the class width?
(b) How many teachers are having the maximum teaching experience and how many have the least teaching experience?
(c) How many teachers have teaching experience of 10 to 20 years?
Solution:
(a) In the histogram, we see that the class width Is 5.
(b) By the histogram, it is clear that two teachers have the maximum teaching experience,i.e. 15-20 years, and five teachers have the least
teaching experience, i.e. 0-5 years.
(c) The number of teachers having experience from 10 to 20 years, is 7 + 2, i.e. 9.