
The following table gives the quantity of goods (in crores of rupees)
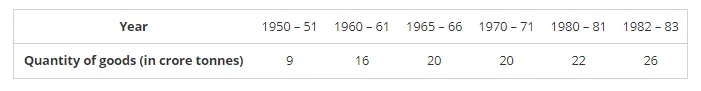
Represent this information with the help of a bar graph.
Explain through the bar graph if the quantity of goods carried by the Indian Railways in 1965-66 is more than double the quantity of goods carried in the year 1950 – 51.
To represent the given data by a vertical bar graph, we first draw horizontal and vertical axes. Let us consider that the horizontal and vertical axes represent the years and the quantity of goods in Crores tonnes respectively. We have to draw 6 bars of different lengths given in the table. At first, we mark 6 points in the horizontal axis at equal distances and erect rectangles of the same width at these points. The heights of the rectangles are proportional to the quantity of goods carried by Indian railways in different years.
The vertical bar graph of the given data is following:
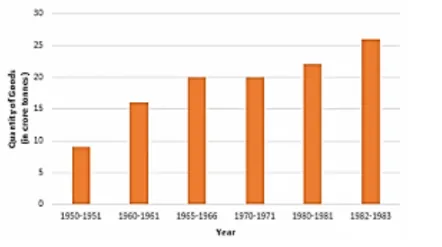
It is seen from the bar graph that the quantity of goods carried in the years 1950 – 51 and 1965 – 66 are 20 Crores tonnes and 9 Crores tonnes. Clearly 20 is more than 2 multiplied by 9. Hence, the statement is true.