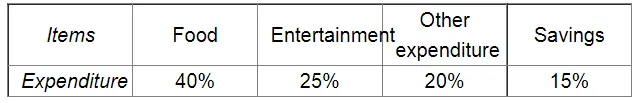
The following table shows how a student spends his pocket money during the course of a month.

The following table shows how a student spends his pocket money during the course of a month. Represent it by a pie-diagram.
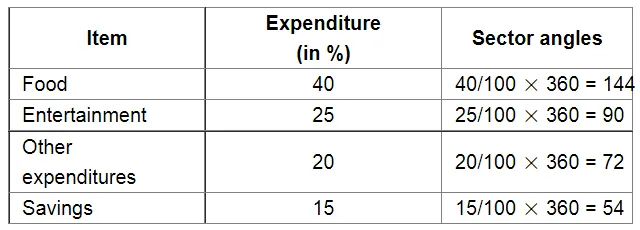
We know:
Central angle of a component $=$ (component value/sum of component values $\times 360^{\circ}$ )
Here, total expenditure = 100%
Thus, central angle for each component can be calculated as follows:
Now, the pie chat representing the given data can be constructed by following the steps below:
Step 1 : Draw circle of an appropriate radius.
Step 2 : Draw a vertical radius of the circle drawn in step 1.
Step 3 : Choose the largest central angle. Here the largest central angle is 144o. Draw a sector with the central angle 144o in such a way that one of its radii coincides with the radius drawn in step 2 and another radius is in its counter clockwise direction.
Step 4 : Construct other sectors representing the other items in the clockwise sense in descending order of magnitudes of their central angles.
Step 5 : Shade the sectors with different colours and label them, as shown as in figure below..webp)