
The following table shows the ages of the patients admitted in a hospital during a year :
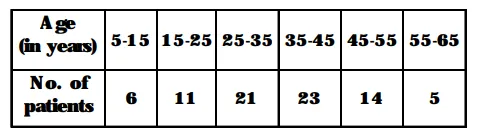
Find the mode and the mean of the data given above. Compare and interpret the two measures of central tendency.
From the given data, we have the modal class 35-45.
$\{\because$ It has largest frequency among the given classes of the data $\}$
So, $\ell=35, \mathrm{f}_{\mathrm{m}}=23, \mathrm{f}_{1}=21, \mathrm{f}_{2}=14$ and $\mathrm{h}=10$.
Mode $=\ell+\left\{\frac{\mathbf{f}_{\mathbf{m}}-\mathbf{f}}{\mathbf{2 f}_{\mathbf{m}}-\mathbf{f}-\mathbf{f}_{\mathbf{2}}}\right\} \times \mathbf{h}$
$=35+\left\{\frac{\mathbf{2 3}-\mathbf{2 1}}{\mathbf{4 6}-\mathbf{2 1}-\mathbf{1 4}}\right\} \times 10=35+\frac{\mathbf{2 0}}{\mathbf{1 1}}=36.8$ years
Now, let us find the mean of the data :
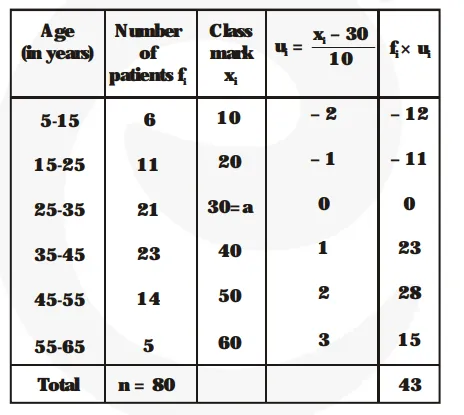
$\mathrm{a}=30, \mathrm{~h}=10, \mathrm{n}=80$ and $\Sigma \mathrm{fu}_{\mathrm{i}} \mathrm{u}_{\mathrm{i}}=43$
Mean $=\mathrm{a}+\mathrm{h} \times \frac{\mathbf{1}}{\mathbf{n}} \times \Sigma \mathrm{f}_{\mathrm{i}} \mathrm{u}_{\mathrm{i}}=30+10 \times \frac{\mathbf{1}}{\mathbf{8 0}} \times 43$
$=30+5.37=35.37$ years
Thus, mode = 36.8 years and mean = 35.37 years.
So, we conclude that the maximum number of patients admitted in the hospital are of the age 36.8 years (approx), whereas on an average the age of a patient admitted to the hospital is 35.37 years.