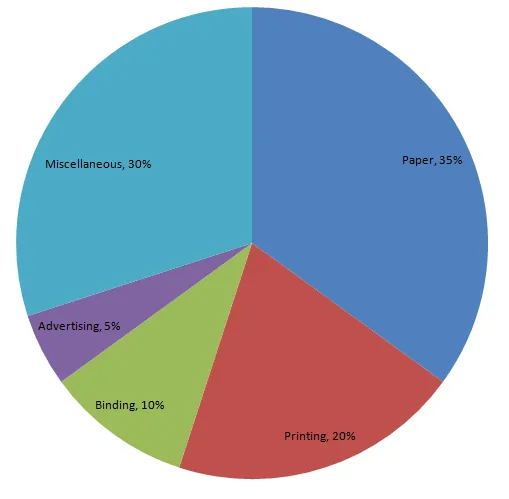
The following table shows the expenditure incurred by a publisher in publishing a book:
| Items | Paper | Printing | Binding | Advertising | Miscellaneous |
| Expenditure (in%) | 35% | 20% | 10% | 5% | 30% |
Present the above data in the form of a pie-chart.
We know:
Central angle of a component = (component value/sum of component values
Here the total % of expenditures = 100%
Thus the central angle for each component can be calculated as follows:
| Item | Expenditure (in %) | Sector angle |
| Paper | 35 | 35/100 |
| Printing | 20 | 20/100 |
| Binding | 10 | 10/100 |
| Advertising | 5 | 5/100 |
| Miscellaneous | 30 | 30/100 |
Now, the pie chat representing the given data can be constructed by following the steps below:
Step 1 : Draw circle of an appropriate radius.
Step 2 : Draw a vertical radius of the circle drawn in step 1.
Step 3 : Choose the largest central angle. Here, the largest central angle is 126o. Draw a sector with the central angle 126o in such a way that one of its radii coincides with the radius drawn in step 2 and another radius is in its counter clockwise direction.
Step 4 : Construct other sectors representing other items in the clockwise direction in descending order of magnitudes of their central angles.
Step 5 : Shade the sectors with different colours and label them, as shown as in figure below.