
Question:
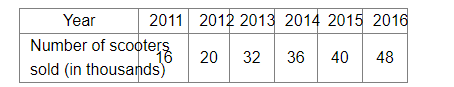
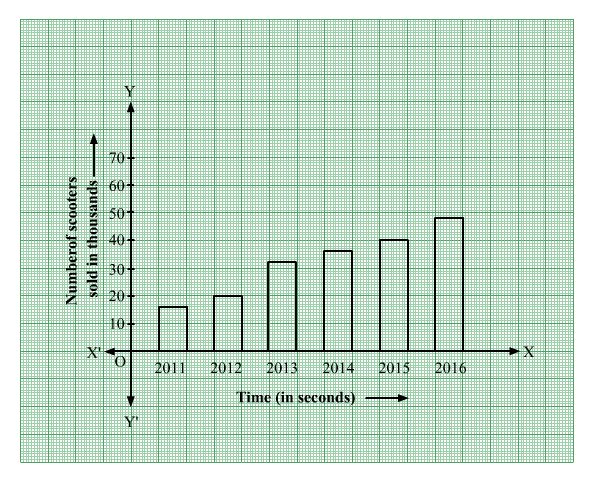
The following table shows the number of scooters sold by a dealer during six consecutive years. Draw a bar graph to represent this data.
Solution:
Comments
Click here to get exam-ready with eSaral
For making your preparation journey smoother of JEE, NEET and Class 8 to 10, grab our app now.