
Question:
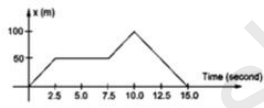
The given figure shows the graph of x-coordinate of a particle going along the X-axis as a function of time. Find
(a) The average velocity during 0 to 10s
(b) Instantaneous velocity at 2, 5, 8 and 12s.
Solution:
(a) Velocity=displacement/time
$=\frac{100}{10}=10 \mathrm{~m} / \mathrm{s}$
(b) Instantaneous velocity=slope of v-t graph
At $t=2.5 \mathrm{~s} ;$ slope $=\frac{50-0}{2.5-0}=20 \mathrm{~m} / \mathrm{s}$
At $t=5 \mathrm{~s} ;$ slope $=0 \mathrm{~m} / \mathrm{s}$
At t $=8 \mathrm{~s}$; slope $=\frac{10.7 .5}{0-100}=20 \mathrm{~m} / \mathrm{s}$
At $t=12$ s; slope $=\frac{0-150}{15-10}=-20 \mathrm{~m} / \mathrm{s}$
Click here to get exam-ready with eSaral
For making your preparation journey smoother of JEE, NEET and Class 8 to 10, grab our app now.